RT-Capture 3 is a SPL (Sound Pressure Level) logging software supporting a number of national and international standards. It is intended for self-governance of sound levels during music events, concerts and festivals.
RT-Capture 3 has octave and third octave logging implemented for environmental noise control.
RT-Capture has integrated networking for web-server over LAN and remote control and display of up to 250 units.
RT-Capture uses a standard PC-soundcard and supports measurements from two microphones.
RT-capture records a log-file with SPL-data (such as Leq, LAmax, LCpeak) and make compressed sound recordings of the audio signal.
The log-file can be watched graphically and audio can be played back from a cursor point in the graph. The SPL-measurement is validated to the IEC 61672 standard and other international standards.
Protocol according to several national standards can be printed. A scheduler can be set to email the log-file during logging.
KEY Features
RT-Capture uses a stereo soundcard and supports 2-channel measurements
Built-in microphone calibration and frequency compensation
All settings can be password-protected and can be saved to a User-preferences file
SPL metering according to IEC 61672 standard.
Built-in weighting filters: A, C, AU and Z (flat)
Selectable time response; Slow (1s) / Fast (0.125s)
Instantaneous SPL Metering (RMS and Peak)
Six different Equivalent Continuous SPL, Leq, are calculated simultaneously; Continuous, Current, Short time (User time), Remaining, Period and Running Leq
All SPL data is event-logged and can be recorded to a log-file along with additional information
Records compressed audio-files for verification, OGG file format.
Logging can be started by a graphical scheduler.
Automatic filename generation.
SPL log-file can be printed in selected time period.
SPL log-file can be exported as tab-separated text format.
SPL log-file can be emailed periodically.
RTA Features
Dual-channel real time spectrum analyzer and running Sonogram simultaneously in the same window.
1/1 to 1/24 octave resolution RTA
Real time spectrum analysis display of both inputs (individually, overlaid or RMS-sum)
A novel Dynamic Difference RTA shows the power transfer function between the channels.
Staircase or Bar Graph display modes
Selectable IEC or Scientific frequency scales
-100 to 200 dB magnitude scaling
Built-in, synchronised noise generator
SPL Displays Features
Two different SPL-displays can de defined independently.Hardware Requirements Computer
See our download page where you can download a demo version and related documents.
![]()
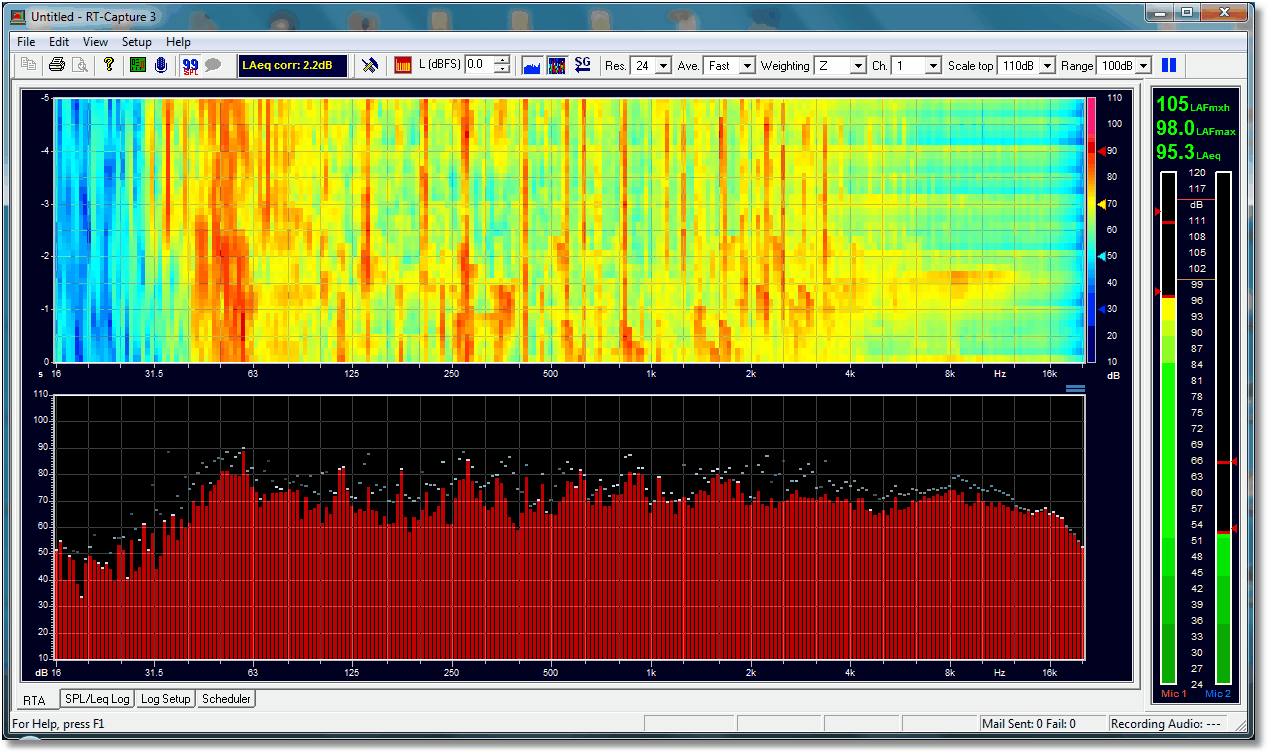
RTA & Sonogram View
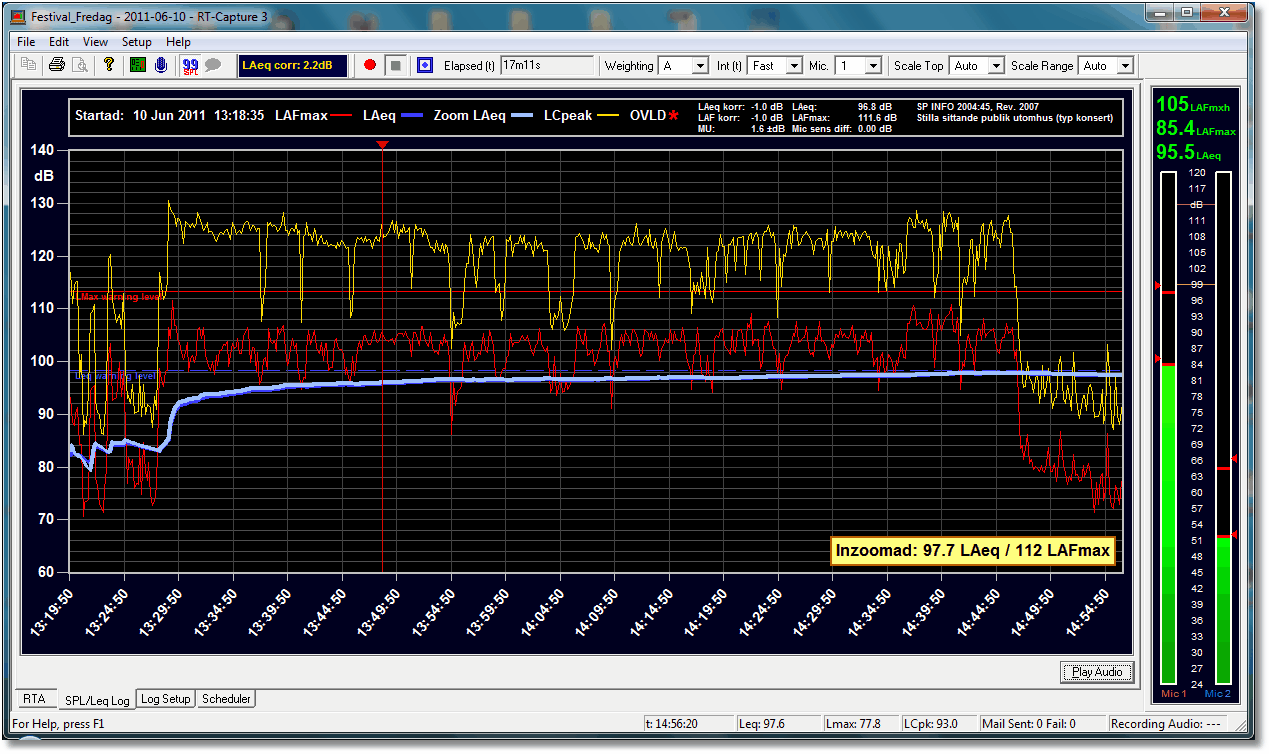
SPL/LEQ Log View
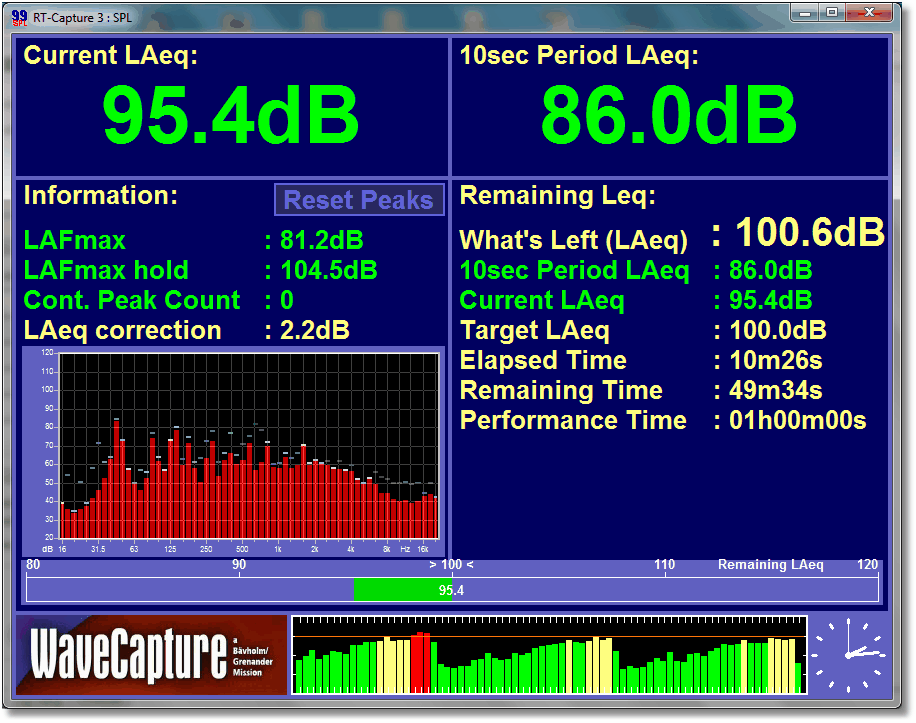
SPL Display - A free floating window that show the the important readings and remaining LEQ.
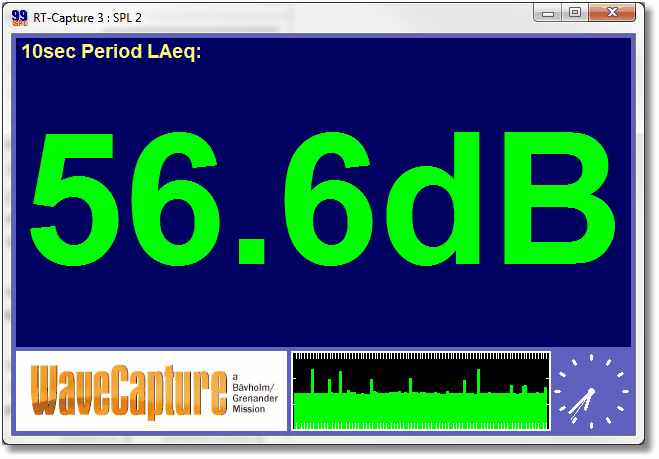
SPL Display 2; simple public display
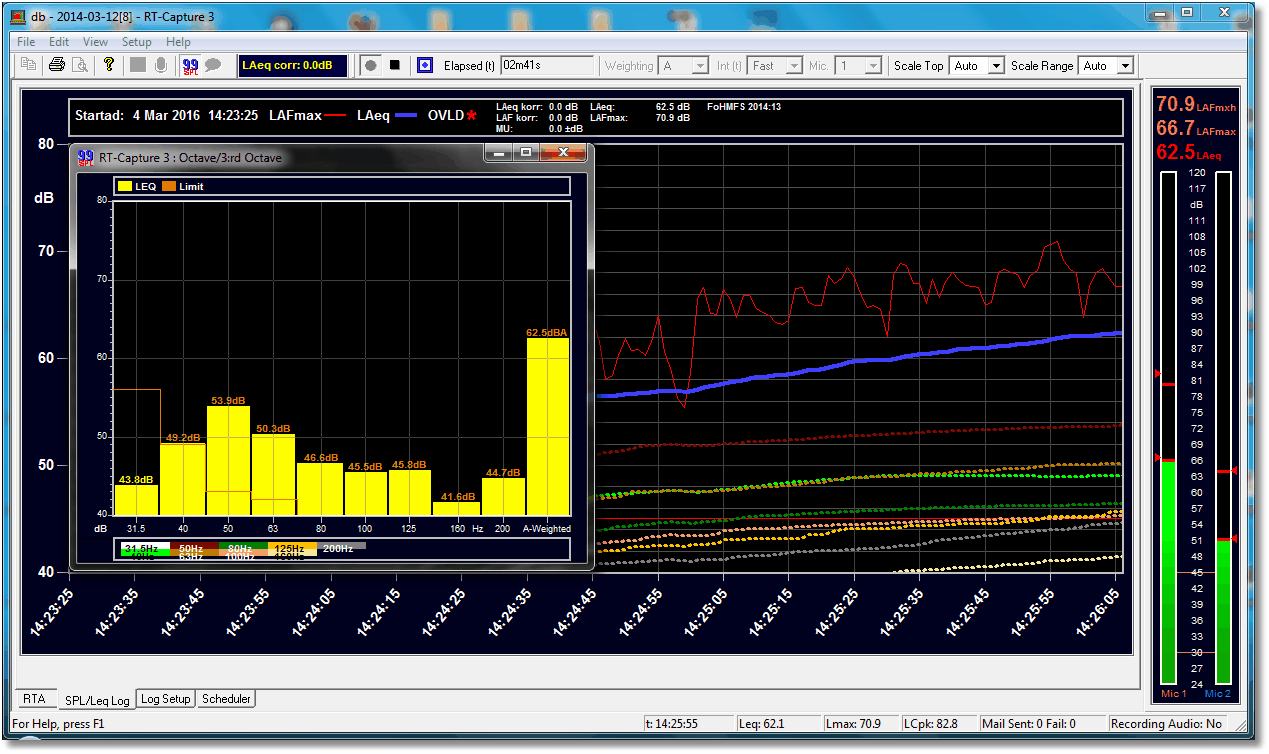
Octave or Third octave Leq Band view
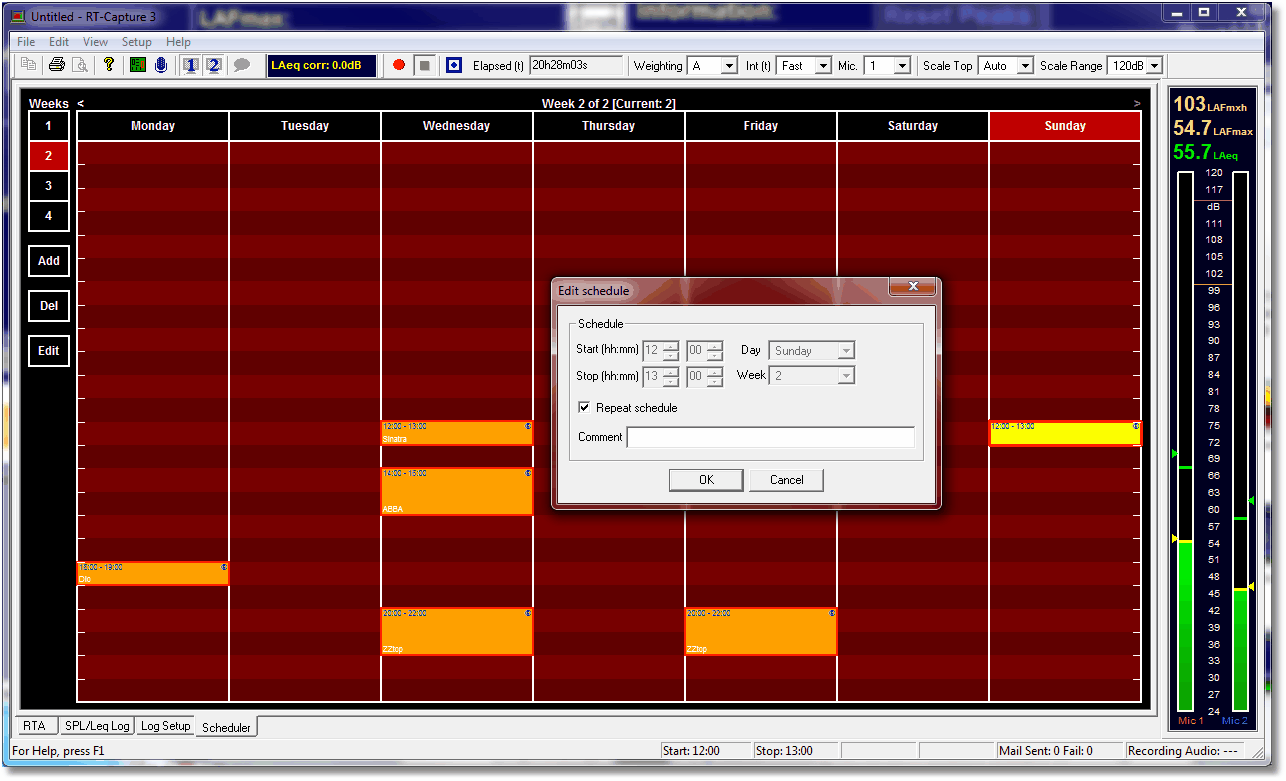
Graphic Scheduler Tab
Copyright
FIR-Capture, Quality-Capture, RT-Capture, Room-Capture, Live-Capture, WaveCapture and their logos are trademarks of GSW and 7dbm Electronics AB, Sweden. Copyright 2006-2016 GSW and 7dbm Electronics AB. All rights reserved. This product is protected by Swedish and International copyright and other intellectual property laws and international treaties. Unauthorized use, distribution or duplication of this product is strictly prohibited.